GLOBAL EMISSIONS
Carbon dioxide emissions are the standard tool used in measuring how much pollution industries and countries are generating. It is CO2 is one of the main gases released during combustion of fossil fuels. However, other gases are released during combustion (such as carbon monoxide, nitrogen dioxide and sulphur dioxide), and these all add to a country’s total emissions.
Read More
However, in order to compare apples with apples, the quantities of these other gases need to be converted into what their equivalent impact (i.e. their potential to act as a greenhouse gas) would be if they were carbon dioxide – called CO2E (Carbon dioxide equivalent). This amount is then then added to the overall total emissions, which are totalled every year. Emissions are measured in metric tonnes – Mt (million tonnes), Gt (giga tonnes = 1000 Mt), and Bt (billion tonnes = 1000 giga tonnes).
Carbon emissions are estimated by adding up the emissions from ALL HUMAN ACTIVITY sources. These activities are all linked in some way to the burning or processing of fossil fuels. These emissions are split up into three groups or scopes, known as Scope 1, Scope 2 and Scope 3.
Examples of human emission sources include:
- Emissions generated from coal and gas for electricity production.
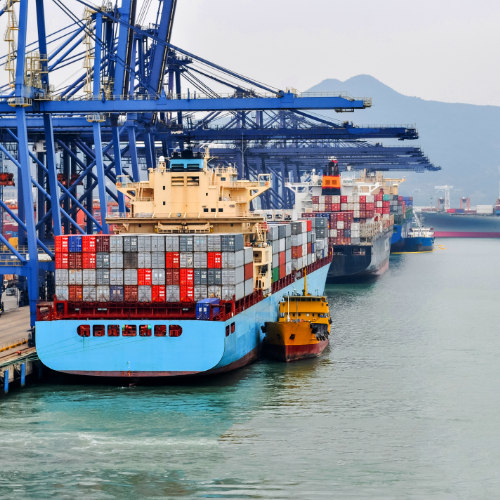
- Emissions generated from vehicles, shipping and aviation.
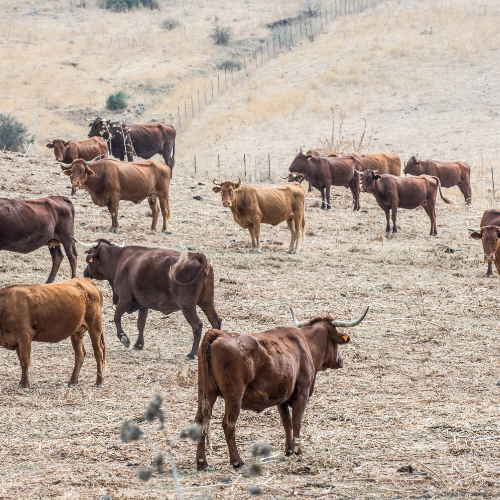
- Emissions generated from agricultural production.
- Emissions generated from industrial activities including manufacturing.
- Emissions generated from service industries including retail and F&B.
- Emissions generated from mining activities.
What does per capita mean?
Per capita means per person. This means that all the carbon emissions for the whole country in one year are divided by the total population for that country (usually these are recorded at the middle of the year, just like a census). The reason this is divided out per person is to ensure that countries can be compared fairly and equally – otherwise we would just be comparing emissions amounts – and this would be unfair as countries with large populations need to provide for these people and so will most likely have larger emissions. To put the following per capita emissions into perspective, the global average of yearly CO2 emissions per capita were about 4.8 tonnes per person in 2017.
Which countries have the largest total emissions?
To be fair, let’s look at a snapshot of CO2 emissions from countries before 2019, which is probably the most representative and recent data to use, given the extraordinary impact that the Covid-19 pandemic has had globally in terms of limiting production and travel in 2019 and 2020. Generally, high-income countries like the USA and Australia have much larger total emissions than low income countries like Zambia and Malawi. The country with the largest total emissions is in fact China (which does not have high average income, but is rapidly industrialising). Its CO2 emissions were 9.8 Bt (billion tonnes) in 2017 (which was 27% of global emissions). The USA had 5.3 Bt or 15% of global emissions in 2017, and Australia’s were 414 Mt (about 1.1% of global emissions)
Which countries have the lowest total emissions?
In 2017, Guinea Bissau had about 300 000 tonnes of emissions, and the small islands in the Philippines such as the Solomon Islands had about 100 000 tonnes. This is due to their small populations, their small land area and their low energy consumption and production patterns (low levels of development and industry).
Which countries have the greatest carbon emissions per capita?
Typically, these countries will be high income countries around the world, where the population has a high standard of living, access to cheap fossil fuels, and demanding consumption patterns. Generally, these countries fall into those that have local crude oil reserves nearby. Top carbon emitters in 2018 per capita include:
- Qatar (37.97 tonnes per capita)
- Curacao (33.63 tonnes per capita)
- Trinidad and Tobago (31.28 tonnes per capita)
To put this into perspective, the per capita consumption levels of the USA and Australia are 16.56 tonnes per capita and 16.88 tonnes per capita respectively. The reason that USA and Australia’s per capita emissions are similar despite their having significantly different total emissions is because USA has a large population and Australia has a small population.
Which countries have the lowest emissions per capita?
Based on the per capita trend described above, the reverse is generally true when looking for countries with low emissions. Poorer, less developed countries with lower consumption patterns, less industrial activities, lower quality of life or civil conflict tend to have much lower per capita emissions.
Some of the lowest emitters in 2018 per capita were:
- Democratic Republic of Congo (0.02 tonnes per capita)
- Burundi (0.05 tonnes per capita)
- Chad (0.07 tonnes per capita)
How do newly industrialising countries compare in their emissions per capita?
Newly industrialising countries (NICs) include countries in the BRICS group (Brazil, Russia, India, China and South Africa). These countries lie somewhere between low income and high-income countries in terms of their economies and average income. Generally, these countries have chosen to follow rapid industrialisation processes in their manufacturing and industry sectors as part of strategies for growing their economies since the 1980’s and 90’s.
In 2018, India had a per capita emission of 1.96 tonnes (in part due to its high population) compared to Australia’s emissions of 16.56 tonnes. South Africa had a per capita emission of 8.09 tonnes – largely because much of the country’s energy comes from coal power stations. Brazil’s per capita emissions were 2.18 tonnes.
Read Less

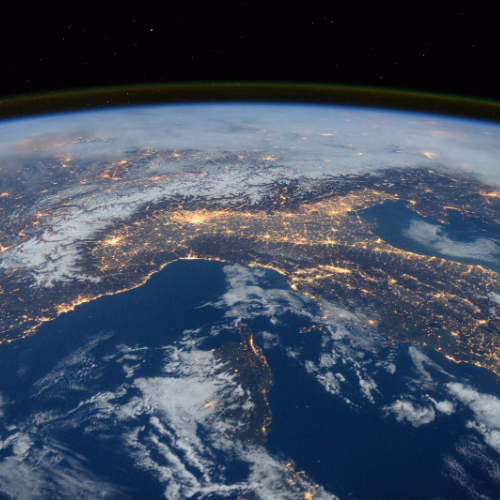
Global Emissions
Carbon dioxide emissions are the standard tool used in measuring how much pollution industries and countries are generating. It is CO2 is one of the main gases released during combustion of fossil fuels. However, other gases are released during combustion (such as carbon monoxide, nitrogen dioxide and sulphur dioxide), and these all add to a country’s total emissions.
Read More
However, in order to compare apples with apples, the quantities of these other gases need to be converted into what their equivalent impact (i.e. their potential to act as a greenhouse gas) would be if they were carbon dioxide – called CO2E (Carbon dioxide equivalent). This amount is then then added to the overall total emissions, which are totalled every year. Emissions are measured in metric tonnes – Mt (million tonnes), Gt (giga tonnes = 1000 Mt), and Bt (billion tonnes = 1000 giga tonnes).
Carbon emissions are estimated by adding up the emissions from ALL HUMAN ACTIVITY sources. These activities are all linked in some way to the burning or processing of fossil fuels. These emissions are split up into three groups or scopes, known as Scope 1, Scope 2 and Scope 3.
Examples of human emission sources include:
- Emissions generated from coal and gas for electricity production.
- Emissions generated from vehicles, shipping and aviation.
- Emissions generated from agricultural production.
- Emissions generated from industrial activities including manufacturing.
- Emissions generated from service industries including retail and F&B.
- Emissions generated from mining activities.
What does per capita mean?
Per capita means per person. This means that all the carbon emissions for the whole country in one year are divided by the total population for that country (usually these are recorded at the middle of the year, just like a census). The reason this is divided out per person is to ensure that countries can be compared fairly and equally – otherwise we would just be comparing emissions amounts – and this would be unfair as countries with large populations need to provide for these people and so will most likely have larger emissions. To put the following per capita emissions into perspective, the global average of yearly CO2 emissions per capita were about 4.8 tonnes per person in 2017.
Which countries have the largest total emissions?
To be fair, let’s look at a snapshot of CO2 emissions from countries before 2019, which is probably the most representative and recent data to use, given the extraordinary impact that the Covid-19 pandemic has had globally in terms of limiting production and travel in 2019 and 2020. Generally, high-income countries like the USA and Australia have much larger total emissions than low income countries like Zambia and Malawi. The country with the largest total emissions is in fact China (which does not have high average income, but is rapidly industrialising). Its CO2 emissions were 9.8 Bt (billion tonnes) in 2017 (which was 27% of global emissions). The USA had 5.3 Bt or 15% of global emissions in 2017, and Australia’s were 414 Mt (about 1.1% of global emissions)
Which countries have the lowest total emissions?
In 2017, Guinea Bissau had about 300 000 tonnes of emissions, and the small islands in the Philippines such as the Solomon Islands had about 100 000 tonnes. This is due to their small populations, their small land area and their low energy consumption and production patterns (low levels of development and industry).
Which countries have the greatest carbon emissions per capita?
Typically, these countries will be high income countries around the world, where the population has a high standard of living, access to cheap fossil fuels, and demanding consumption patterns. Generally, these countries fall into those that have local crude oil reserves nearby. Top carbon emitters in 2018 per capita include:
- Qatar (37.97 tonnes per capita)
- Curacao (33.63 tonnes per capita)
- Trinidad and Tobago (31.28 tonnes per capita)
To put this into perspective, the per capita consumption levels of the USA and Australia are 16.56 tonnes per capita and 16.88 tonnes per capita respectively. The reason that USA and Australia’s per capita emissions are similar despite their having significantly different total emissions is because USA has a large population and Australia has a small population.
Which countries have the lowest emissions per capita?
Based on the per capita trend described above, the reverse is generally true when looking for countries with low emissions. Poorer, less developed countries with lower consumption patterns, less industrial activities, lower quality of life or civil conflict tend to have much lower per capita emissions.
Some of the lowest emitters in 2018 per capita were:
- Democratic Republic of Congo (0.02 tonnes per capita)
- Burundi (0.05 tonnes per capita)
- Chad (0.07 tonnes per capita)
How do newly industrialising countries compare in their emissions per capita?
Newly industrialising countries (NICs) include countries in the BRICS group (Brazil, Russia, India, China and South Africa). These countries lie somewhere between low income and high-income countries in terms of their economies and average income. Generally, these countries have chosen to follow rapid industrialisation processes in their manufacturing and industry sectors as part of strategies for growing their economies since the 1980’s and 90’s.
In 2018, India had a per capita emission of 1.96 tonnes (in part due to its high population) compared to Australia’s emissions of 16.56 tonnes. South Africa had a per capita emission of 8.09 tonnes – largely because much of the country’s energy comes from coal power stations. Brazil’s per capita emissions were 2.18 tonnes.
Read Less
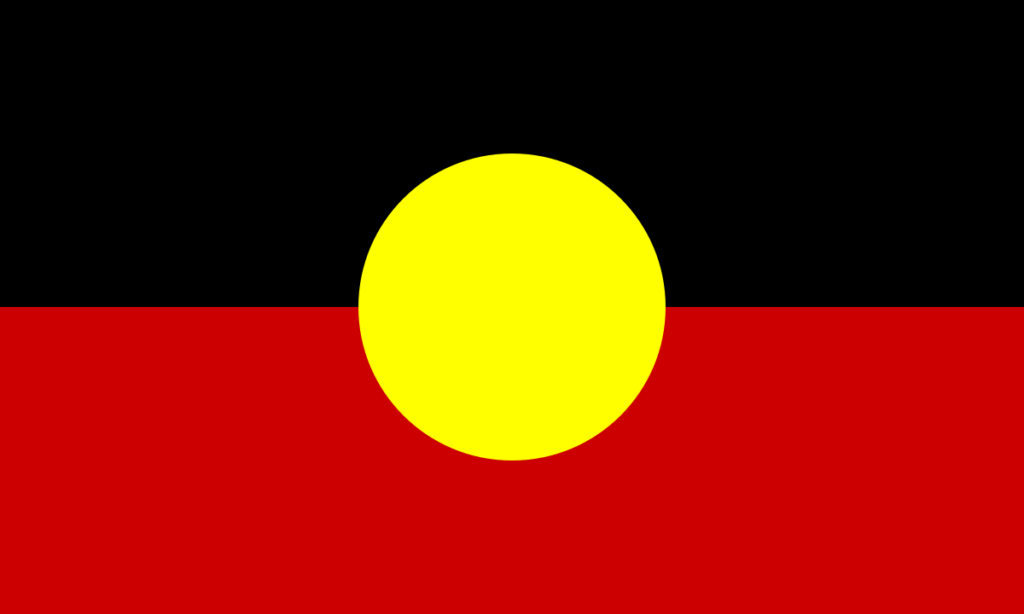
Carbon Offset Advisory acknowledges the traditional owners and custodians of country throughout Australia and acknowledges their continuing connection to land, water and community.
We pay our respects to the people, the cultures and the elders past, present and emerging.